
Smart Glucose Meter
New Trends tab: Easily explore your glucose data like never before
Published: Mar. 13, 2026
Updated: Sep. 21, 2026
5 min read
The content in this article should not be taken as medical advice. Please consult your healthcare provider regarding your individual health needs.
If you use a Dexcom G7 Continuous Glucose Monitoring (CGM) System, you already know how helpful it is to see your glucose readings in real time. But understanding the bigger picture - your patterns and trends (like time in range) -can make a big difference in managing your diabetes day to day. That’s where the new Trends tab in the Dexcom G7 app comes in.
The Trends tab organizes your glucose data in one simple hub, giving you easier access to even more information you can use to guide daily decisions and have informed discussions with your doctor at appointments.
What is the Trends tab?
Think of it as your personal dashboard for managing your glucose. If you’ve been a Dexcom CGM user for a while, you’ve probably switched between the Dexcom Clarity and Dexcom G7 apps to see all your data. Now with the Trends tab, it’s all in one place—no extra logins, no app hopping, just quick access to the numbers that matter most. Future updates will include even more data.
What data can you find in the Trends tab?
The Trends tab consolidates and organizes important information you need to understand your glucose patterns. It’s broken out into two views:
- Overview
- Daily
Overview – A summary view of all key glucose metrics across 3, 7, 14, 30, or 90 days.
- Time in range: The percentage of time that glucose levels are in low, target, and high ranges. Time in Range is one of the most important metrics for daily management of diabetes. Time in Range can be viewed in both:
- Default Range: 3.9 – 10.0 mmol/L
- Custom Target Range: A target range you set based on your personal preferences.
- Average glucose: Your average glucose levels over the selected timeframe.
- Average Day Graph: Combines all days in the selected timeframe into a single 24‑hour view so you can see common patterns and trends.
- Sensor Usage: The percentage of time your sensor captured glucose data. International standards recommend at least 70% over 14 days to ensure there is enough data to accurately identify glucose trends.
- GMI (Glucose Management Indicator): An estimate of your A1C based on your CGM data that you and your healthcare provider can use to support treatment decisions.
- Logged Insulin Doses: Review insulin doses you’ve logged to help identify patterns you may want to discuss with your healthcare provider.
- Post Meal Glucose: Displays how many meals you’ve logged and the percentage of those meals that fall within your selected post-meal glucose target.
- Fasting Glucose: Shows the percentage of logged fasting glucose events within your set target, your average fasting glucose level, and the number of fasting events logged.
- Glucose Variability: Indicates how much your glucose levels change over time. This is shown using the Coefficient of Variation (%CV). A lower %CV means glucose levels are more stable and closer to your average.
Daily Views – The Daily view lets you explore glucose information for an individual day and displays the following metrics:
- Time in Range
- Sensor usage
- Average glucose
- Glucose variability
- Glucose trend graph
- Logged events for that day
You can review individual days going as far back as 180 days.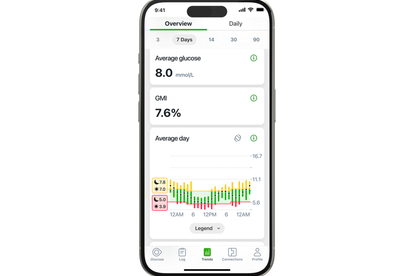
All of this is presented in a clear, intuitive format so you can focus on what matters most: living your life with confidence and control.
Why you'll love the Trends tab
Easy to use and understand: It's designed for simplicity. No extra steps, no complicated navigation—just a quick tap to see a clear summary of all your most important glucose data.
More convenient: It puts everything in one place. Now it’s easier to review your progress without juggling multiple apps, so you can stay on top of your glucose patterns and prepare for appointments.
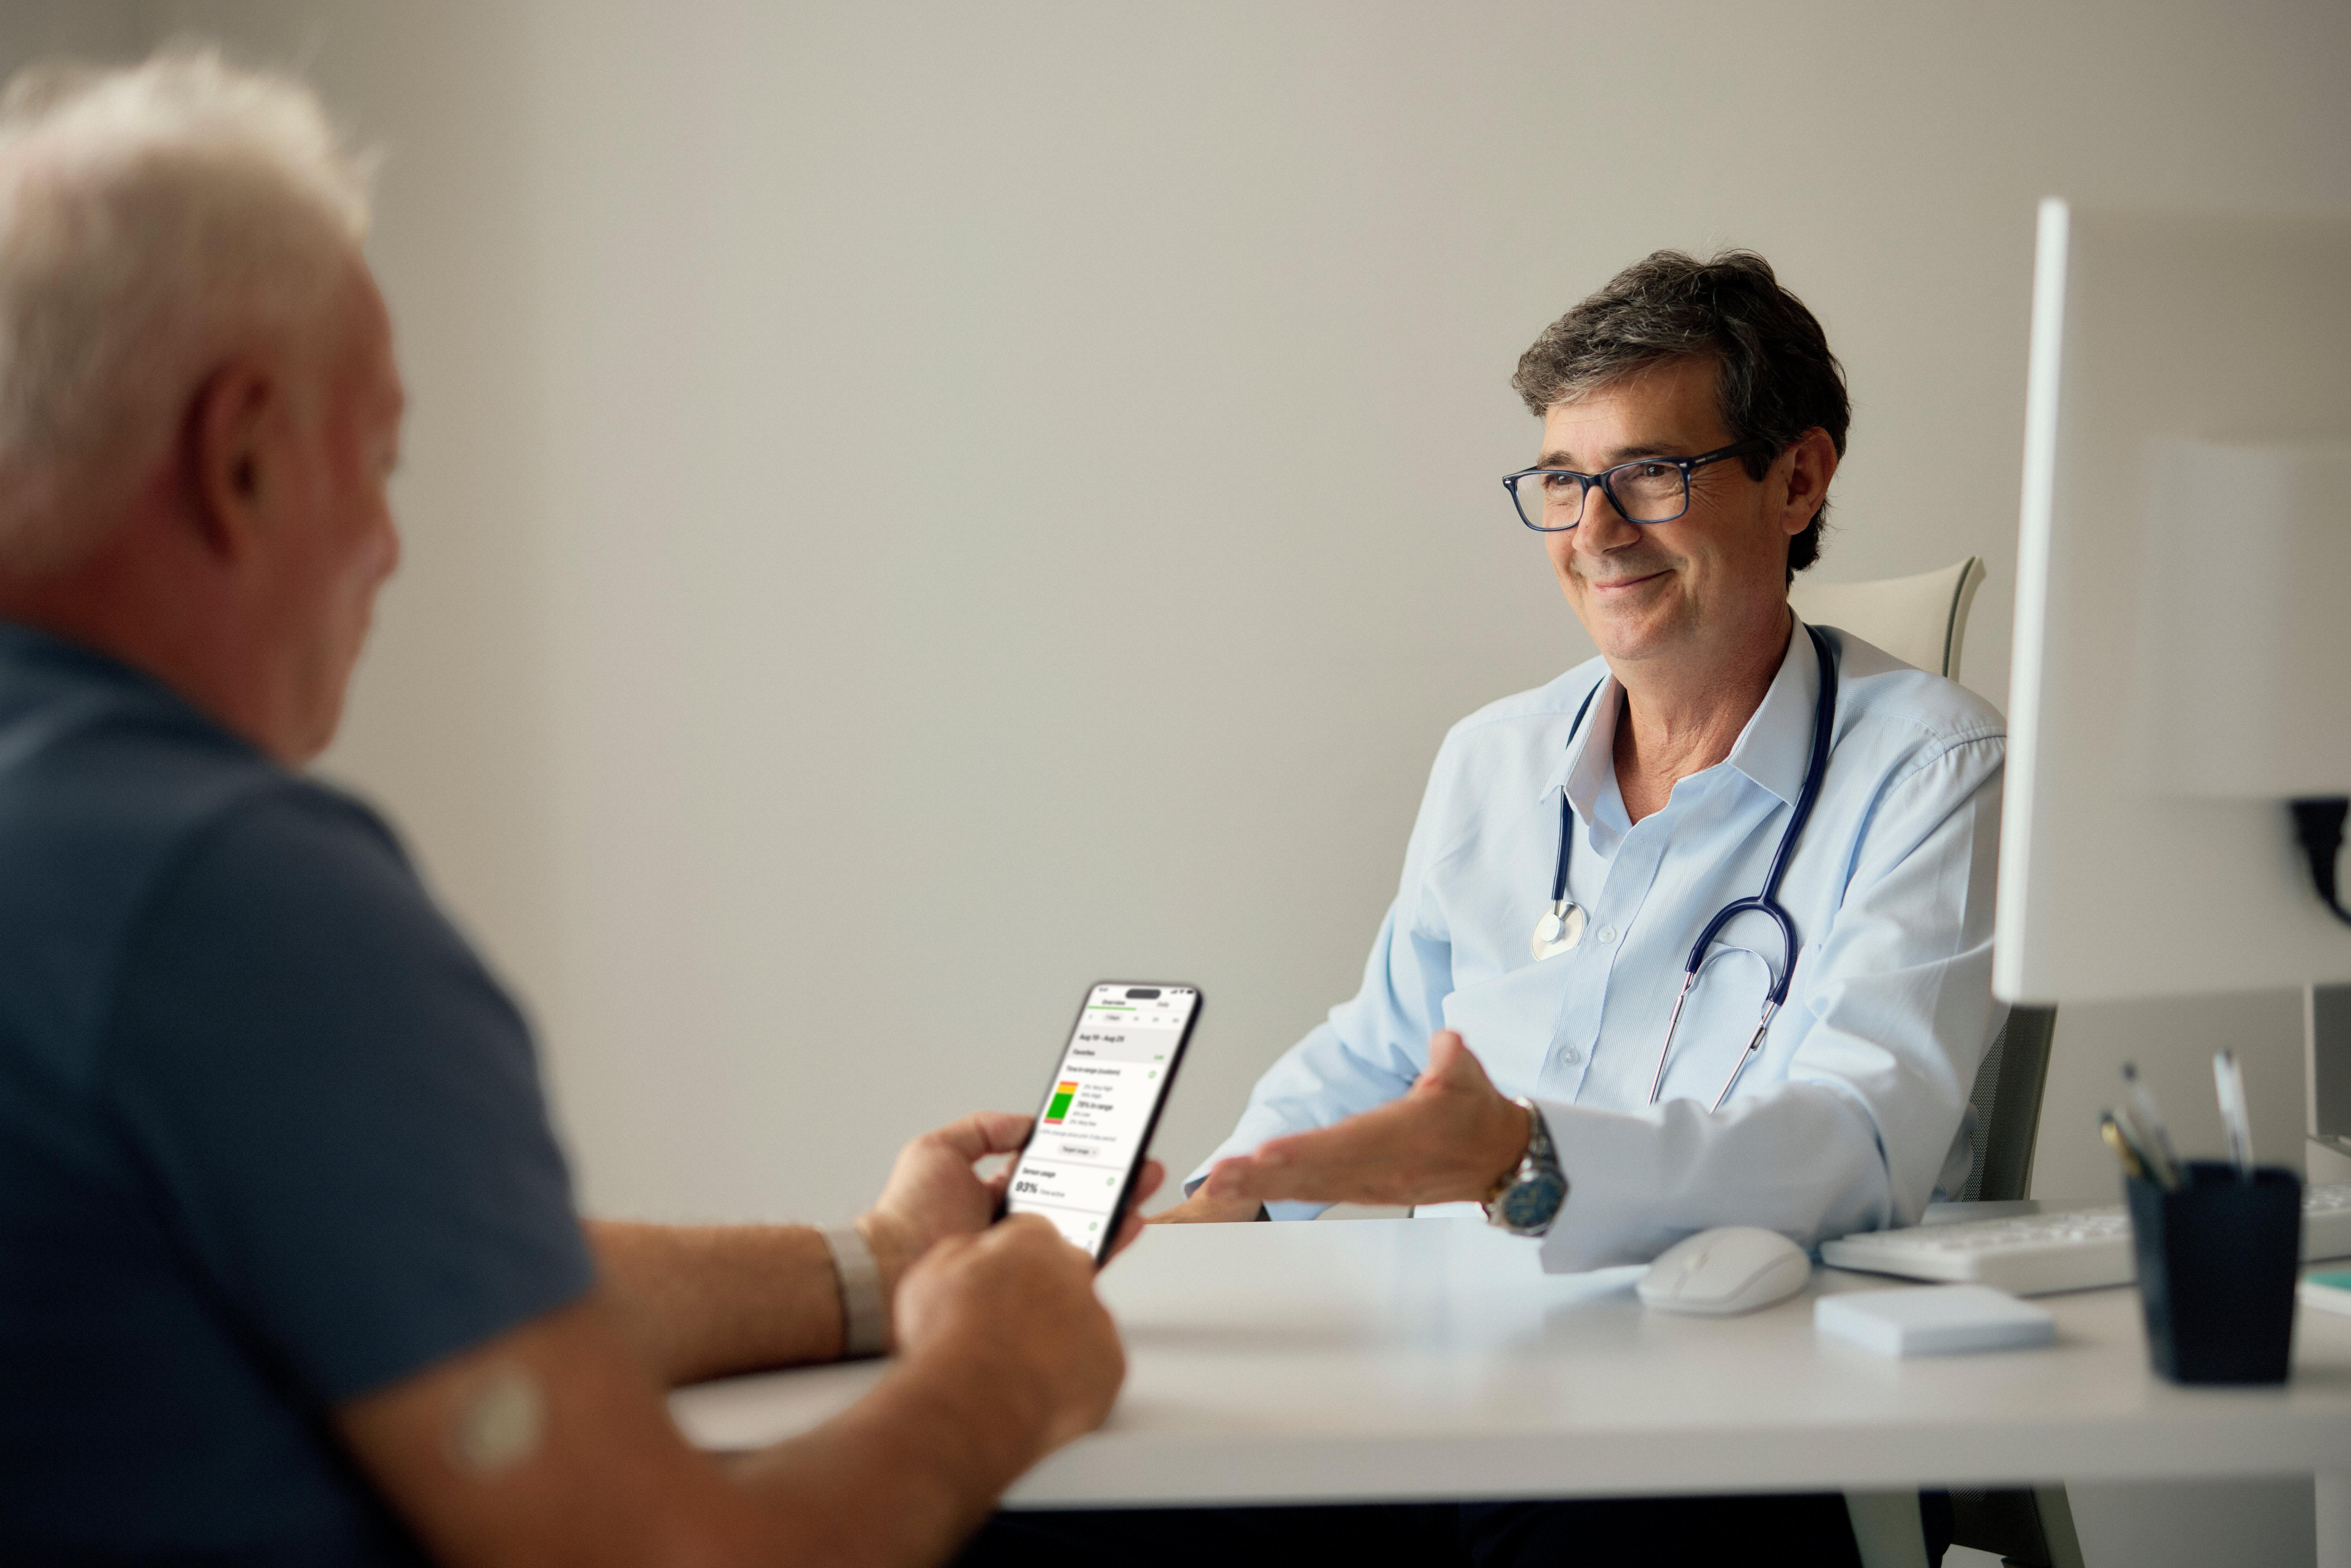
Helpful at doctor's appointments: With more glucose data easily accessible in one place, sharing insights with your healthcare provider is simple. Now you can quickly pull up a complete picture of your glucose trends, time in range, and insulin events during your appointment and have more productive conversations with your doctor.
Ready to try it out?
Update your Dexcom G7 app to version 2.15
If you haven’t already, head to the App Store or Google Play and update the app to take advantage of your new all-in-one glucose data hub.
If you haven’t already, head to the App Store or Google Play and update the app to take advantage of your new all-in-one glucose data hub.
Get started on Dexcom G7 CGM
Not using Dexcom G7 yet? Now is the perfect time to get started, and it's conveniently available at the pharmacy.
Not using Dexcom G7 yet? Now is the perfect time to get started, and it's conveniently available at the pharmacy.
App Store is a registered trademark of Apple Inc. Google Play is a trademark of Google LLC.
BRIEF SAFETY STATEMENT: Failure to use the Dexcom Continuous Glucose Monitoring System and its components according to the instructions for use provided with your device and available at https://www.dexcom.com/safety-information and to properly consider all indications, contraindications, warnings, precautions, and cautions in those instructions for use may result in you missing a severe hypoglycemia (low blood glucose) or hyperglycemia (high blood glucose) occurrence and/or making a treatment decision that may result in injury. If your glucose alerts and readings from the Dexcom CGM do not match symptoms, use a blood glucose meter to make diabetes treatment decisions. Seek medical advice and attention when appropriate, including for any medical emergency.