
What can I find on the Trends tab of my Dexcom G7 app?
The Trends tab helps you understand your glucose patterns by organizing key information in one place. It includes two views:
- Overview
- Daily
Overviews – The Overview provides a summary of your key glucose metrics across 3, 7, 14, 30, or 90 days, helping you spot patterns over time.
- Time in range: The percentage of time that glucose levels are in low, target, and high ranges. Time in Range is one of the most important metrics for daily management of diabetes. Time in Range can be viewed in both:
- Default Range: 70-180 mg/dl
- Custom Target Range: A target range you set based on your personal preferences.
- Average glucose: Your average glucose levels over the selected timeframe.
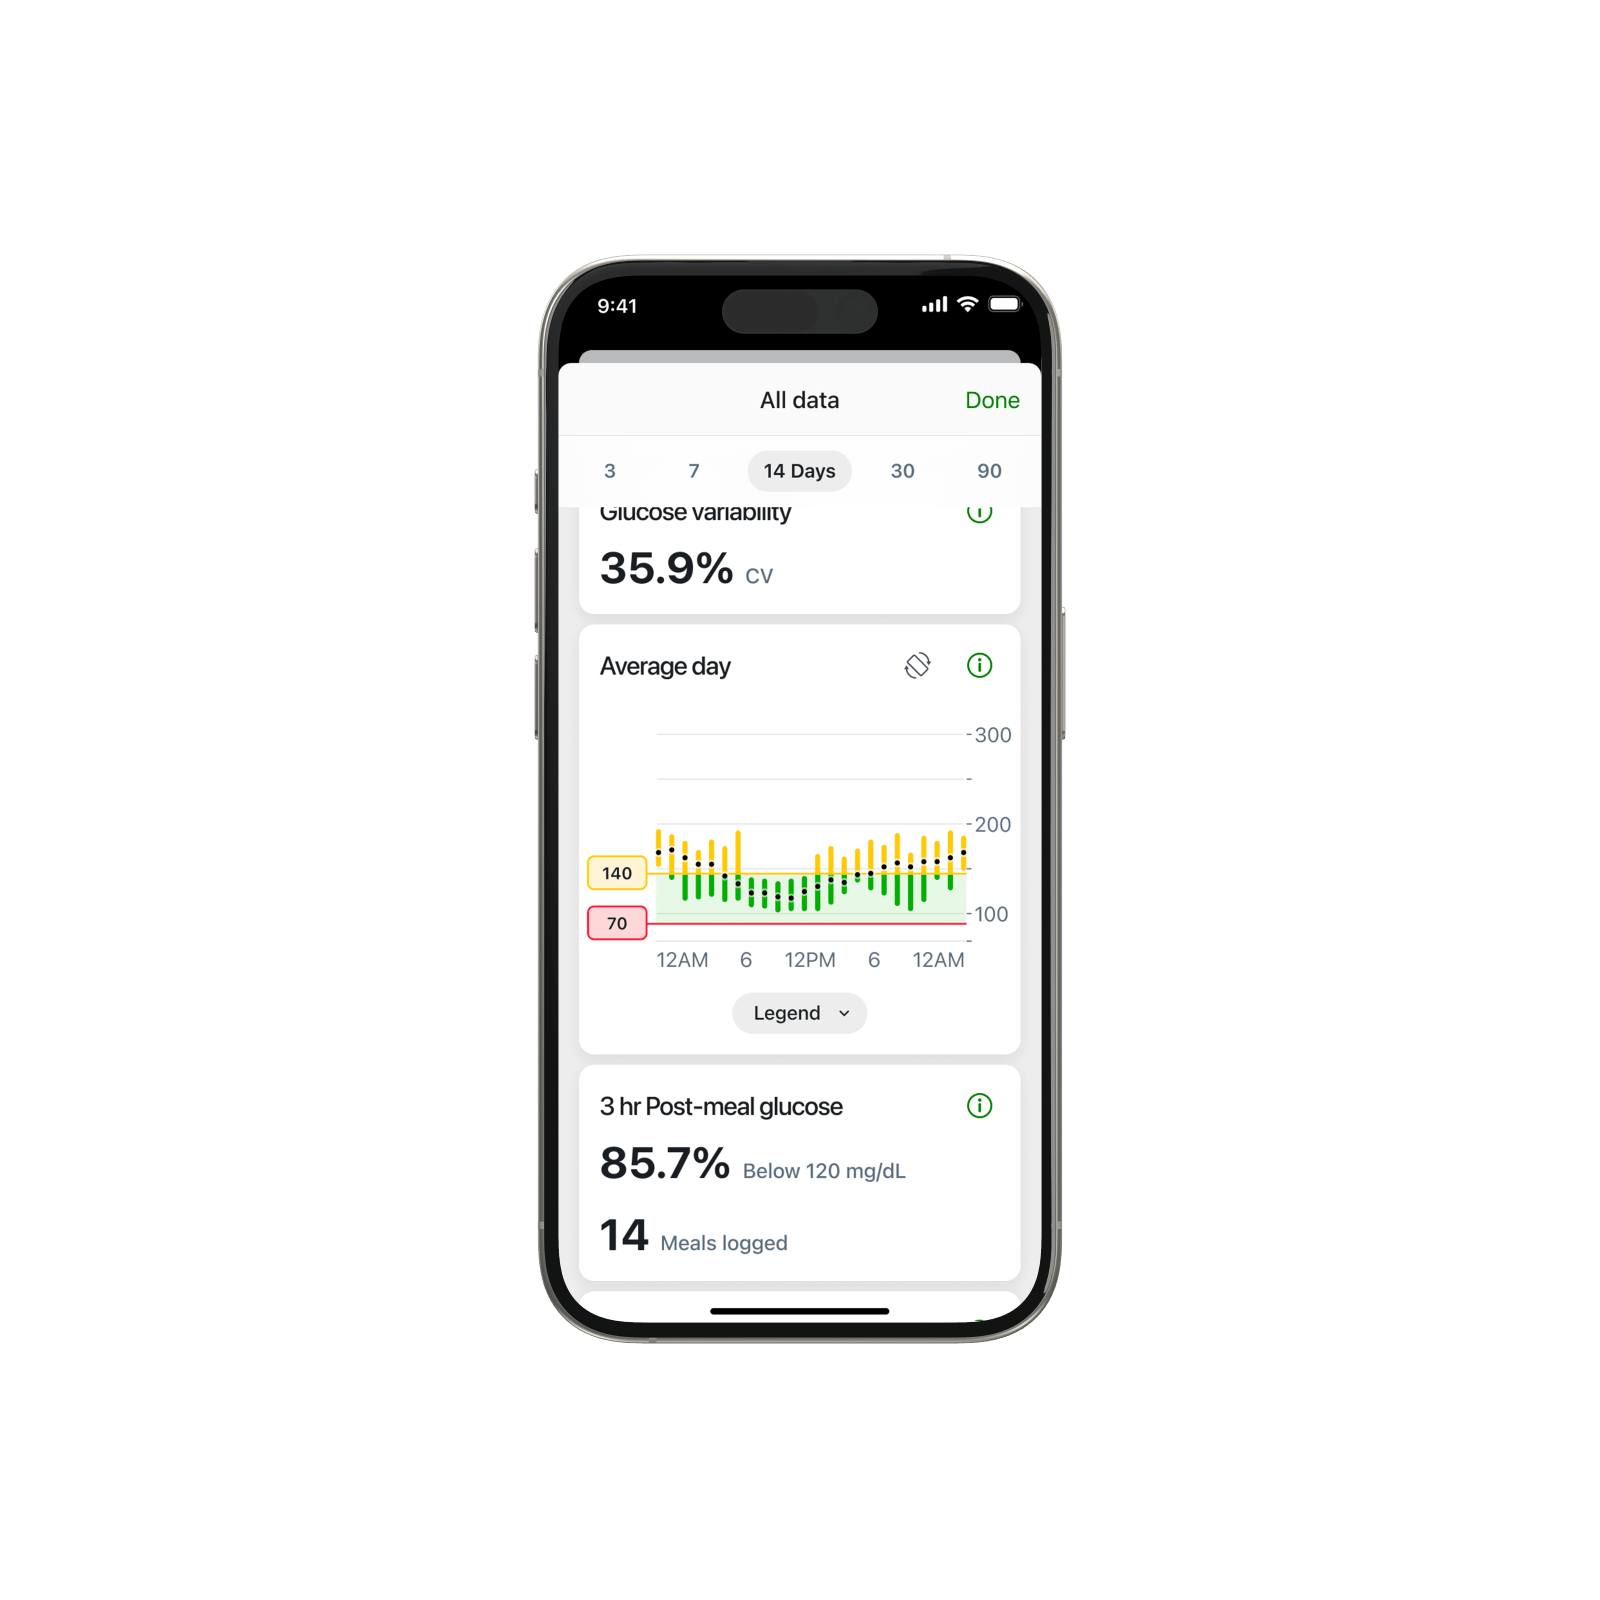
- Average Day Graph: Combines all days in the selected timeframe into a single 24‑hour view so you can see common patterns and trends.
- Sensor Usage: The percentage of time your sensor captured glucose data. International standards recommend at least 70% over 14 days to ensure there is enough data to accurately identify glucose trends.
- GMI (Glucose Management Indicator): An estimate of your A1C based on your CGM data that you and your healthcare provider can use to support treatment decisions.
- Logged Insulin Doses: Review insulin doses you’ve logged to help identify patterns you may want to discuss with your healthcare provider.
- Post Meal Glucose: Displays how many meals you’ve logged and the percentage of those meals that fall within your selected post meal glucose target.
- Fasting Glucose: Shows the percentage of logged fasting glucose events within your set target, your average fasting glucose level, and the number of fasting events logged.
- Glucose Variability: Indicates how much your glucose levels change over time. This is shown using the Coefficient of Variation (%CV). A lower %CV means glucose levels are more stable and closer to your average.
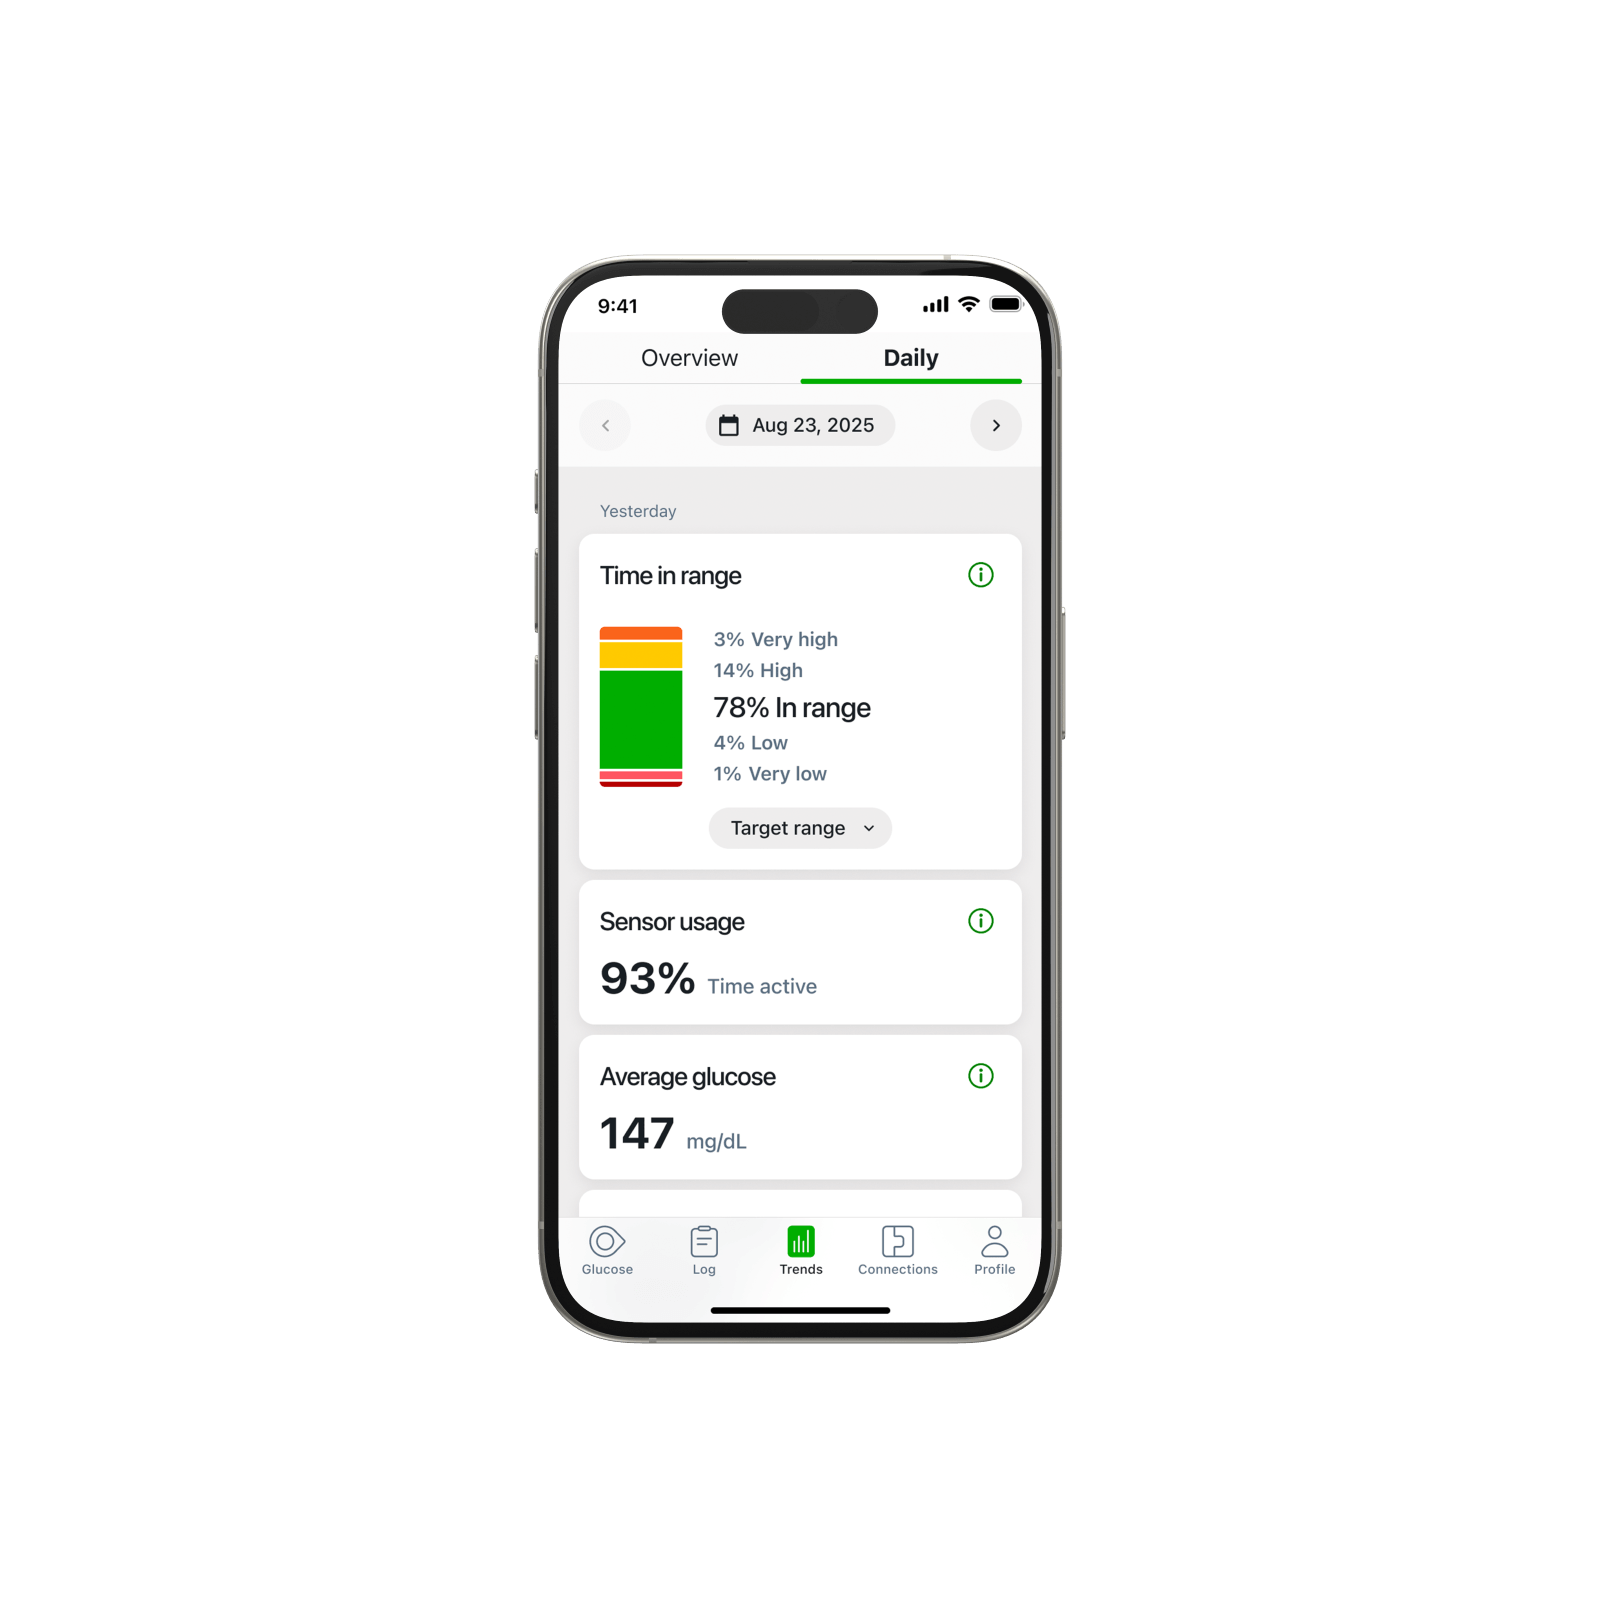
Daily Views – The Daily view lets you explore glucose information for an individual day and displays the following metrics:
- Time in Range
- Sensor usage
- Average glucose
- Glucose variability
- Glucose trend graph
- Logged events for that day
You can review individual days going back up to 180 days.
Sharing with your Doctor
The Trends tab makes it easy to show your glucose information directly from your smartphone* during doctors appointments, helping your doctor quickly review your data.
Future app updates will continue to add new features to the Trends tab.
 |  |
*Compatible smart devices sold separately. To view a list of compatible smart devices, visit dexcom.com/compatibility
MAT-1042